
Executive Summary
Post-Earnings Announcement Drift (PEAD) is one of the most well-documented anomalies in financial markets: stock prices continue to move in the direction of an earnings surprise for weeks after the announcement. Following the two-factor framework proposed by Brandt, Kishore, Santa-Clara and Venkatachalam (2008), this strategy exploits PEAD using two complementary signals, Standardized Unexpected Earnings (SUE) and Earnings Announcement Return (EAR), to construct a long-short portfolio that targets the drift effect.
Our analysis covers 508 stocks across NYSE, NASDAQ, and NYSE ARCA from 1996 to 2026, with 18,881 stock-quarter observations. Both active and delisted stocks are included to mitigate survivorship bias. Returns are benchmarked against matched Fama-French size and book-to-market portfolios, isolating the PEAD alpha from known risk premia.
Strategy Design
Factor Construction
SUE (Standardized Unexpected Earnings) measures how much reported EPS deviates from analyst consensus, normalized by the historical volatility of surprises for that stock. It captures the fundamental information content of each earnings report. Comparing to the seasonal random walk SUE instead uses the change in EPS from the same quarter one year ago divided by its rolling standard deviation, so it relies purely on the company’s own historical earnings pattern rather than analyst forecasts.
EAR (Earnings Announcement Return) is the stock’s 3-day cumulative abnormal return around the announcement date (day -1 to day +1), computed against a matched Fama-French 6-portfolio benchmark. It captures the market’s immediate reaction, including information from guidance, conference calls, and order flow.
These two signals have a near-zero correlation (0.004), confirming they capture distinct aspects of the earnings event and provide genuine diversification when combined.
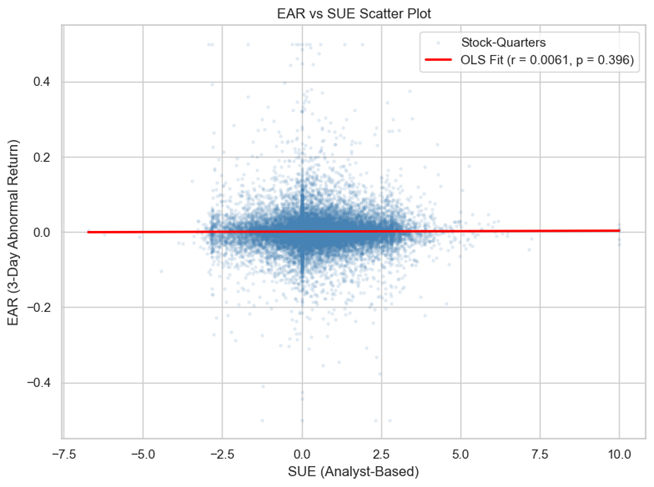
Figure 1: Correlation of EAR and SUE (Analyst-based)
The SUE factor shows the expected positive drift: stocks with the best earnings surprises continue to outperform over the subsequent quarter. The EAR single-factor spread shows reversal, the market overreacts on announcement day, and some of that initial move fades over time. Part of the explanation is that the Fama-French absorbs some of the initial price reaction, but the combined two-factor approach yields a meaningful 5.48% annualized spread.
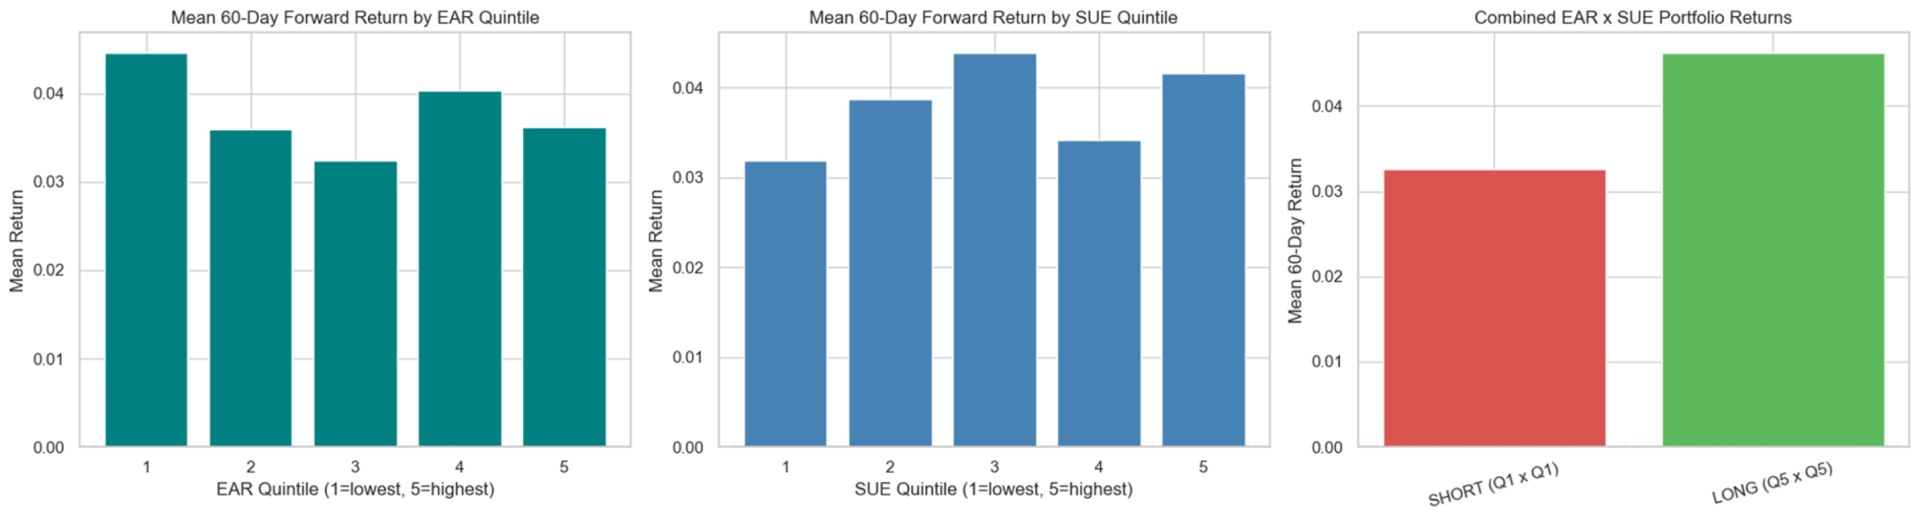
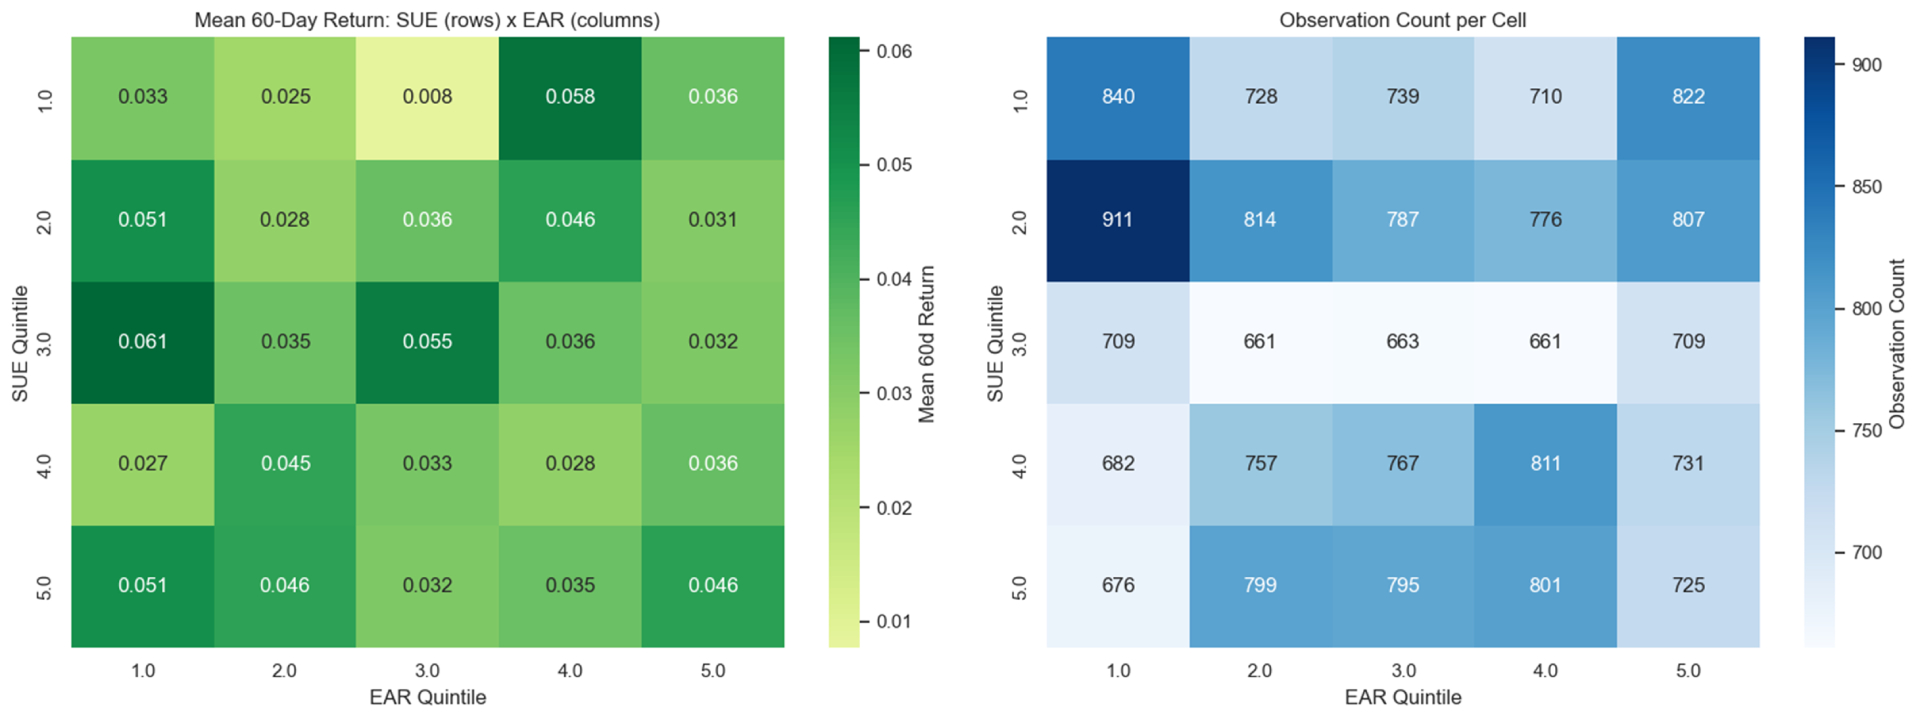
Figure 2: Mean Forward Returns by EAR and SUE Quintile (5×5 Grid)
Portfolio Construction
Each quarter, stocks are independently sorted into quintiles on both SUE and EAR. The long portfolio holds the intersection of the top quintiles (Q5 SUE and Q5 EAR), consisting of stocks with the best earnings surprises and strongest market reactions. The short portfolio holds the intersection of the bottom quintiles (Q1 SUE and Q1 EAR). Positions are held for 60 trading days (approximately one quarter) before rebalancing.
Empirical Results
Single-Factor Spreads (Annualized)
| Factor | Q5-Q1 Spread | Interpretation |
|---|---|---|
| SUE | +3.91% | Positive earnings surprises drift upward |
| EAR | -3.39% | Reversal in announcement returns |
Portfolio Performance
| Portfolio | 60-Day Return | Annualized | Observations |
|---|---|---|---|
| Long (Q5 x Q5) | 4.63% | 18.50% | 725 |
| Short (Q1 x Q1) | 3.26% | 13.03% | 840 |
Key Considerations
Benchmark choice matters significantly. Upgrading from a single SPY benchmark to Fama-French size/book-to-market portfolios better isolates the drift effect by removing known risk premia. The analysis covers 508 stocks and includes 48 delisted companies (6.6%) to partially address survivorship bias. Transaction costs are not modelled; the PEAD effect is historically strongest in small-cap stocks where trading costs are highest. Investors should consider capacity constraints and implementation costs when evaluating this strategy.
Practical Takeaways for Investors
You do not need a quantitative trading desk to benefit from the PEAD effect. The core insight is straightforward: when a company reports earnings that meaningfully beat or miss expectations, the stock price tends to keep moving in that same direction for weeks afterward. Markets under-react to new information, and that creates an opportunity for patient investors.
- Pay attention to earnings surprise magnitude
When a stock beats analyst estimates by a wide margin (high SUE), the data shows it tends to continue outperforming over the following quarter. Large misses show the opposite pattern. Free earnings calendars and surprise data are available on sites like Seeking Alpha, Earnings Whispers, and Yahoo Finance. After each earnings season, look for the biggest positive surprises among stocks you already follow. - Watch the announcement-day reaction too
The EAR signal captures information beyond just the headline number: management guidance, conference call tone, and order flow all show up in the stock’s immediate price move. When a big earnings beat is paired with a strong positive price reaction on the day, that combination historically produces the best forward returns. - Think in quarters, not days
PEAD is not a day-trading signal. The drift unfolds over roughly 60 trading days. If you buy a stock after a strong earnings surprise, plan to hold for at least one quarter. This aligns well with a typical portfolio rebalancing cadence and keeps transaction costs manageable. - Be mindful of where the effect is strongest
Academic research consistently finds that PEAD is most pronounced in smaller, less-followed stocks where analyst coverage is thin and information takes longer to get priced in. The opportunities are in the part of the market where large institutional funds have less presence. However, smaller stocks also come with wider bid-ask spreads and lower liquidity, so position sizing matters.